What a Gantt chart is actually for (and when you don't need one)
Published May 12, 2026
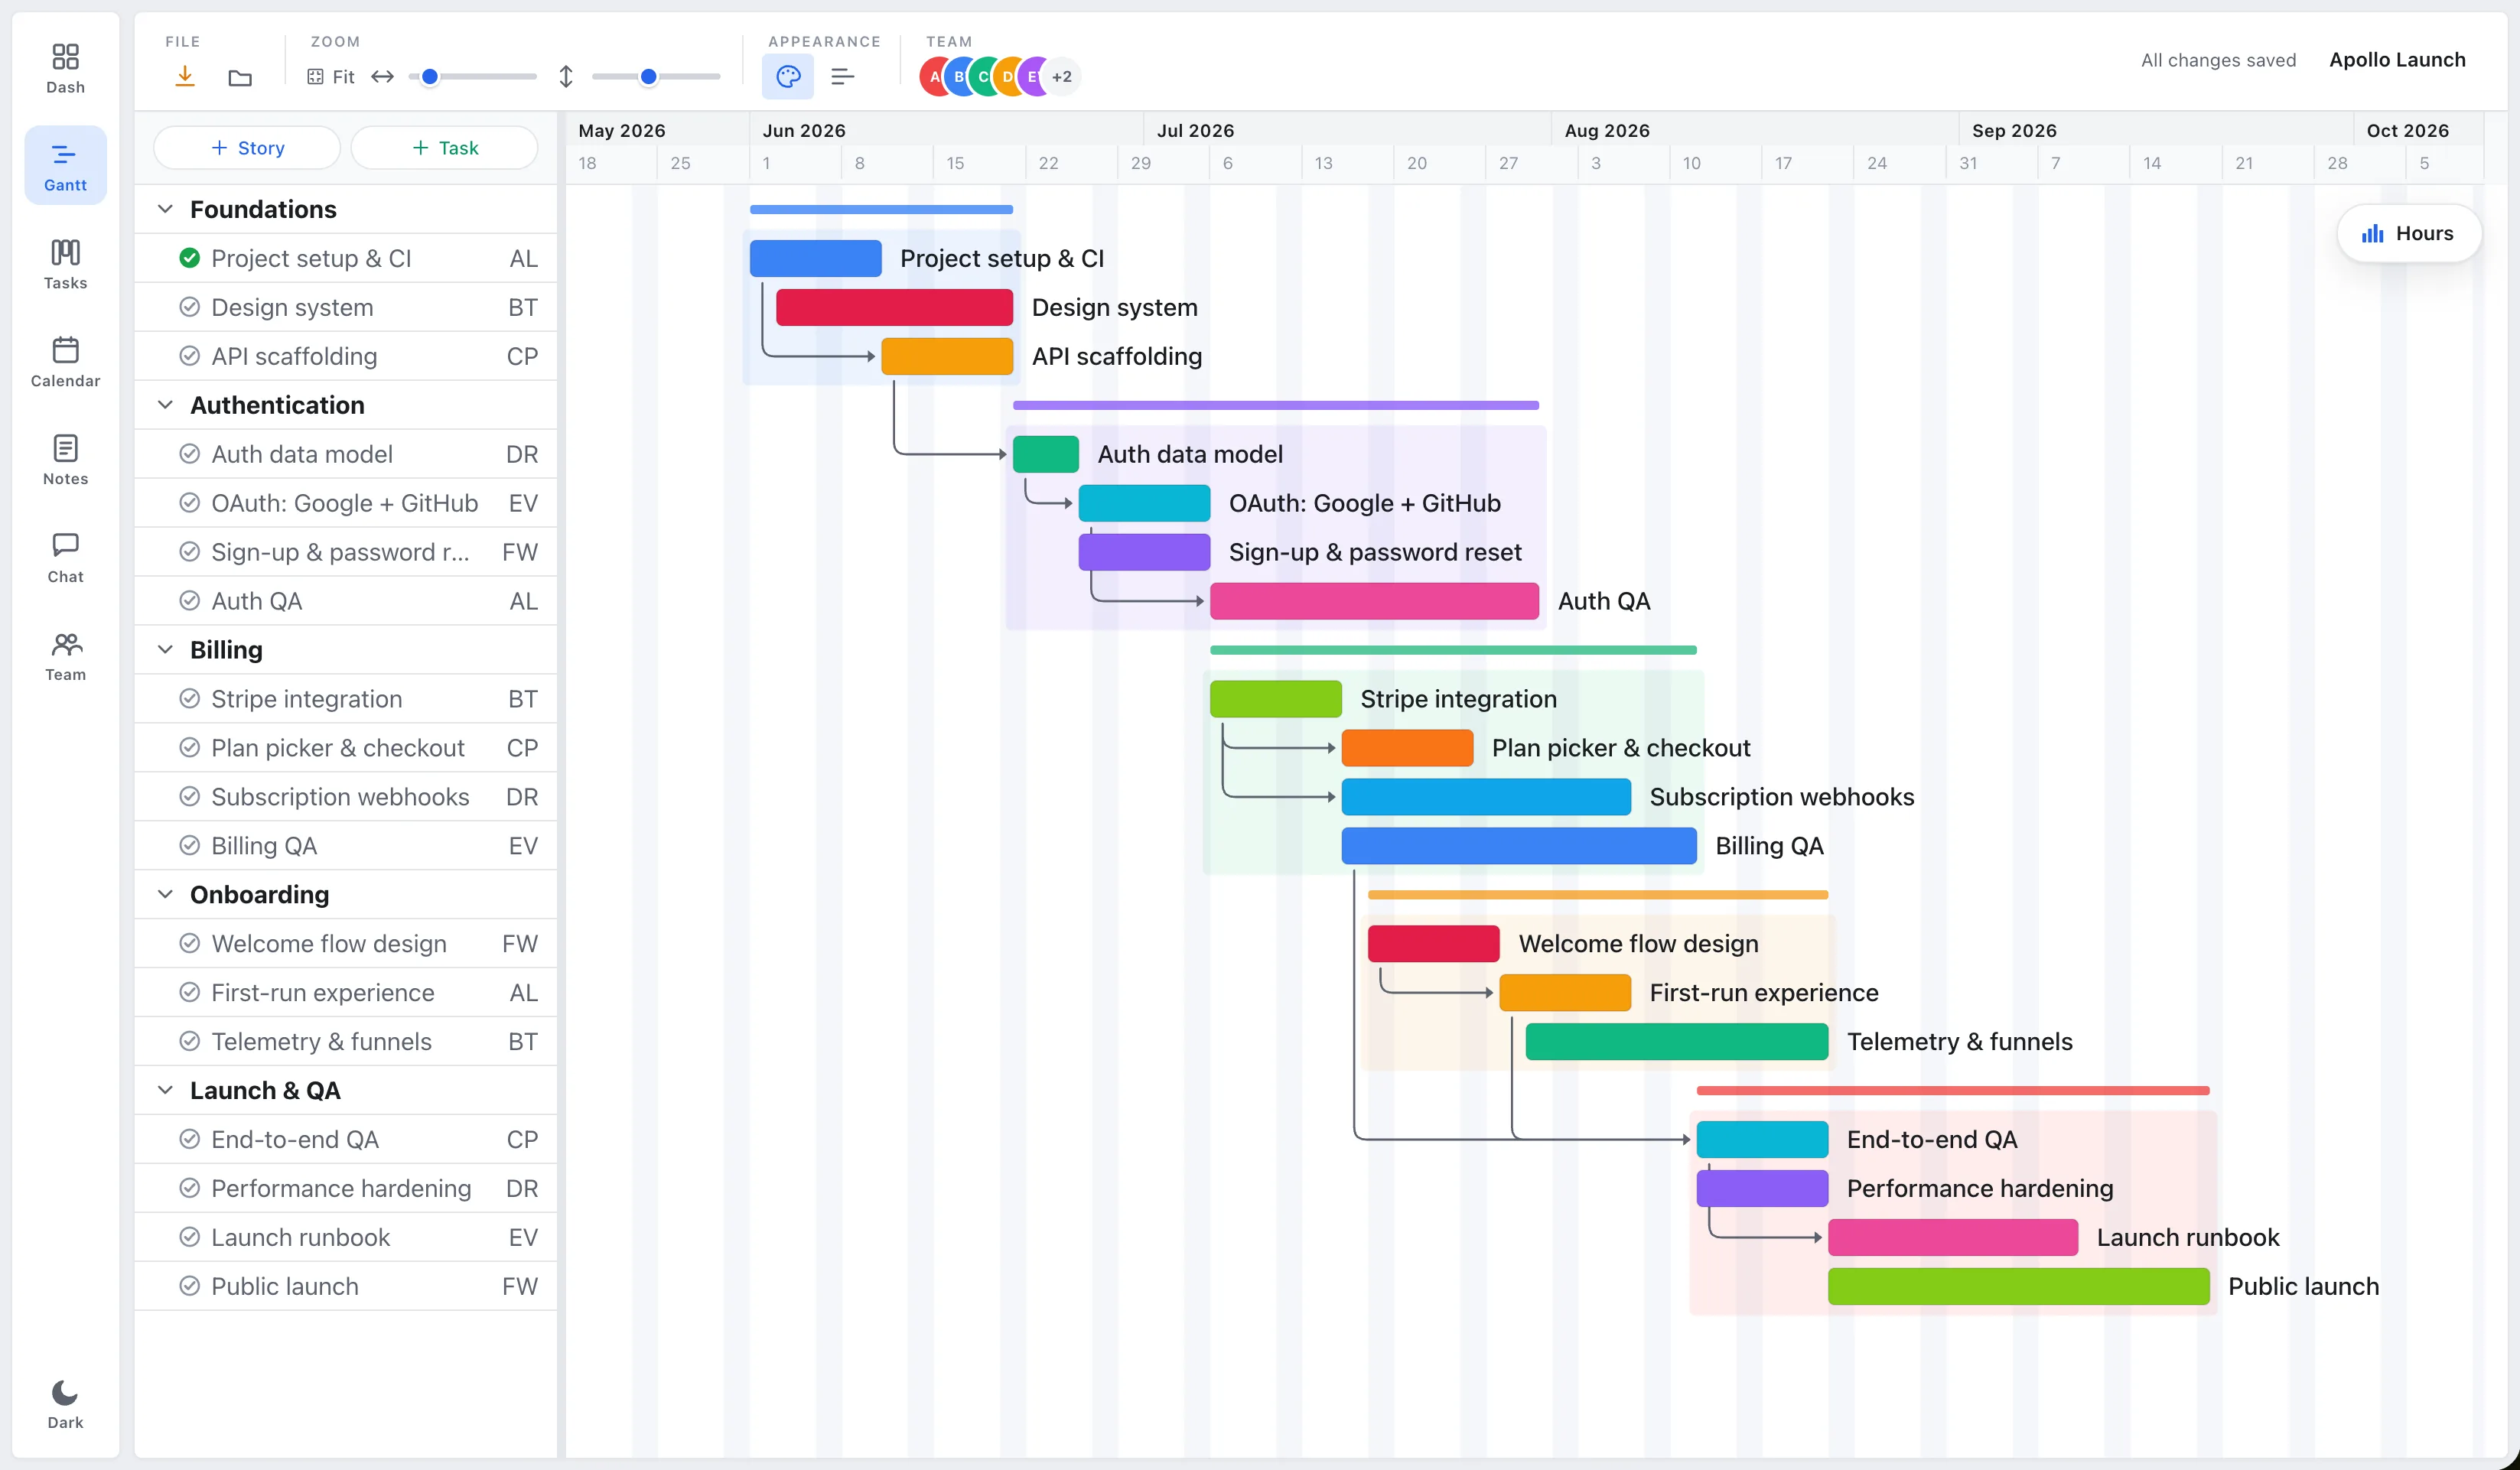
A Gantt chart is a timeline view of a project. Each task is a horizontal bar: where it starts, how long it runs, and how it connects to the tasks around it. That’s it. The name comes from Henry Gantt, who popularized the format over a century ago, which tells you the idea is older and simpler than the software industry would like you to believe.
So what is it actually for?
The one thing a Gantt chart is great at
Showing what depends on what, and what happens when something slips.
A to-do list tells you the work. A Gantt chart tells you the consequences. When the design review runs three days late, you can see, instantly, that it pushes the build, which pushes QA, which pushes the launch. That cascade is invisible on a flat list and obvious on a timeline.
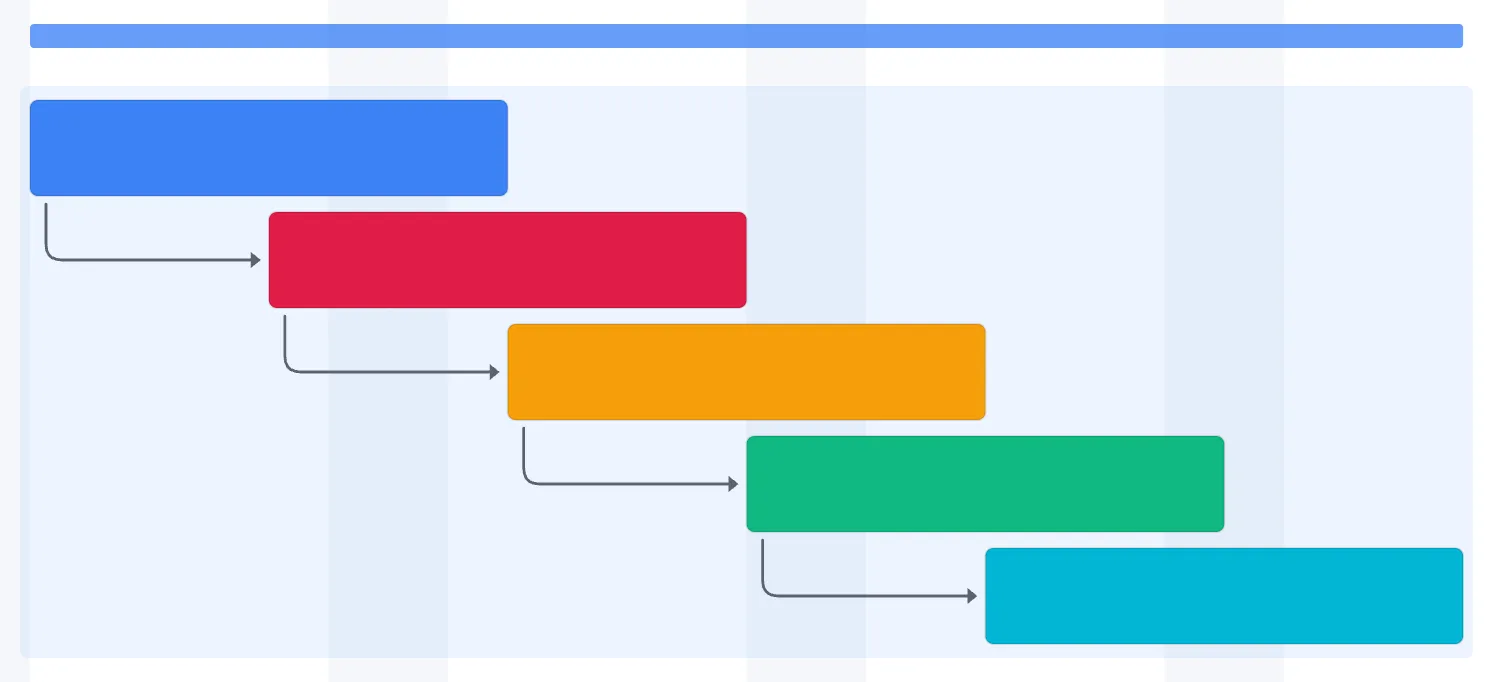
The bars carry three pieces of information at a glance:
- Duration, how long each task takes (the width of the bar).
- Sequence, what comes before what (the arrows between bars).
- Overlap, what’s happening in parallel (bars stacked in the same week).
That’s why Gantt charts stuck around: for anything with real dependencies and a real deadline, nothing communicates the shape of the plan faster.
When you don’t need one
Be honest about your project. You probably don’t need a Gantt chart if:
- The tasks are mostly independent (a backlog of unrelated bugs).
- There’s no hard deadline that a slip would threaten.
- You’re a team of one or two and the whole plan fits in your head.
In those cases a simple task list or a Kanban board is lighter and just as effective. A Gantt chart earns its keep when sequencing and timing matter, not before.
The mistake isn’t choosing the wrong view. It’s being forced into one. The same project is sometimes a timeline (when you’re planning dates), sometimes a board (when you’re working the week), and sometimes a list (when you just need to check things off).
That’s how EverGantt treats it: build the plan once, then look at it as a Gantt chart, a board, or a list depending on what you’re doing. Free to build and export in your browser.
Try it free. Related: the project features small teams actually use · how to plan a project in your browser in 10 minutes.
Frequently asked questions
What is a Gantt chart?
A Gantt chart is a timeline view of a project where each task is a horizontal bar showing when it starts, how long it runs, and how it connects to other tasks. It makes scheduling and dependencies visible at a glance.
What is a Gantt chart used for?
It's best at showing what depends on what, and what happens when something slips. When one task runs late, a Gantt chart shows the downstream tasks it pushes, a cascade that's invisible on a flat to-do list.
When should you not use a Gantt chart?
Skip it when tasks are mostly independent, there's no hard deadline, or the whole plan fits in your head. A simple list or a Kanban board is lighter and just as effective in those cases.
Who invented the Gantt chart?
It's named after Henry Gantt, who popularized the format over a century ago. The idea is older and simpler than modern project-management software suggests.